C.I.E. 1931 Chromaticity Diagram

 
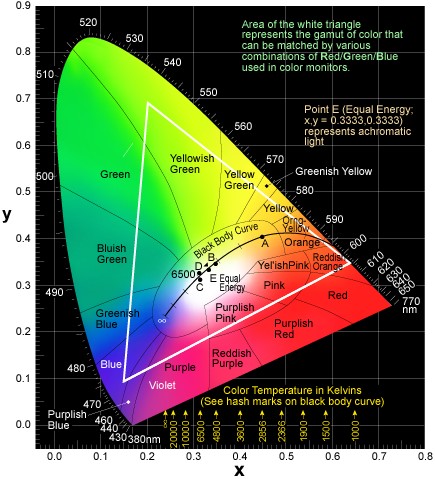
Chart is provided for an understanding of color relationships. RGB monitors and printed materials cannot reproduce the full gamut of the color spectrum as perceived in human vision. The color areas shown only depict rough categories and are not precise statements of color.
Standard Illuminants

CIE Color Matching Functions

Source A x = 0.4476
y = 0.4075


Primary source: Photo Research

Source B x = 0.3485
y = 0.3517
Source C x = 0.3101
y = 0.3163
Source D65 x = 0.3127
y = 0.3291
Source E x = 0.3333
y = 0.3333